Informatics

CITATION: Poussard, K., Elkins, C. & Gilbert, G.E. (2021). Can you hear me now? A patient portal initiative program to increase patient engagement in an outpatient primary care setting. Online Journal of Nursing Informatics (OJNI), 25(1).
Abstract
Background: Patient portals are an effective way of engaging patients to become active participants in their health; however, getting patients to actively use portals in the outpatient setting is challenging.
Purpose: This article discusses implementation of a patient portal initiative program in an outpatient primary care setting to increase patient engagement and patient portal adoption. Design: Provider promotion, portal marketing, and hands-on illustration using the Plan Do Study Act to increase portal utilization.
Results: The portal initiative program increased patient engagement, including increasing portal users, logins, secure messages, and lab views within an eight-week timeframe.
Introduction
An important area of discussion is the use of patient portals or web portals and its relation to patient engagement. The term “patient engagement” is commonly used but often poorly understood in healthcare. Therefore, for this discussion, patient engagement is defined as the patient’s capability and willingness to actively decide to participate in their healthcare and collaborate with a healthcare facility or provider for the goal of improvement in care or positive outcomes (Higgins et al., 2017). Providers can promote patient engagement through health information technology (HIT) by using practical and appealing designs to maximize patient involvement (Higgins et al., 2017; Schnall et al., 2016).
Portal adoption and use leads to positive health outcomes, improved patient-provider communication through secure messaging, and increased patient participation in healthcare decisions (Nagykaldi et al., 2012; Fiks et al., 2016; Fleming et al., 2015; Sawesi et al., 2016; Wildenbos et al., 2017). Furthermore, financial incentives, such as the merit-based incentive payment system (MIPS) by the Centers for Medicare and Medicaid Services (CMS) are driving factors for providers and administrators to implement portal adoption and use (Esmaeilzadeh & Sambasivan, 2016; Hess, 2019). Additional benefits of using HIT through portal adoption include increased patient satisfaction, greater patient retention, increased workflow, and reduced waste (Otte-Trojel et al., 2014). Portal adoption and use creates collaboration between providers and patients, encourages patients to show up for appointments and preventative wellness services, and increases medication adherence (Kruse et al., 2015; Irizarry et al., 2015; Lyles et al., 2016; Rodriguez, 2018). Patient portal adoption is congruent with the Institute of Medicine’s aims for improvement because portals are efficient, timely, and most successful when they are patient-centered (Kruse et al., 2015; Caldwell et al., 2017).
Due to positive patient outcomes and financial incentives related to HIT through patient portal use, digital health interventions are more readily available to patients in both inpatient and outpatient settings. Although many of the incentives emphasize having patients view, download, and transmit their healthcare data electronically, no set guidelines existed on how to assist primary care practices in meeting this goal (Lafata et al., 2018). Evidence regarding barriers and limitations to patient portals are being brought into the forefront. Factors such as race, sex, age, socioeconomic status, and health conditions are limitations affecting portal adoption. Removing these barriers is supported through stakeholder buy-in, patient attitudes and perceptions, marketing, and information technology (IT) support (Zhao et al., 2017).
Framework
A Plan Do Study Act (PDSA) model was used as the framework for this study due to its allowance for continuous improvement and flexibility, including promotion of project sustainability (Donnelly & Kirk, 2015). Additionally, the Empowerment Informatics Framework was chosen to guide the integration of patient-empowering technology (Knight & Shea, 2014). Empowering patients with health- enabling technologies to increase self-management and patient-defined goals is the outcome of the portal initiative program (Francis, 2017).
Background
A gap analysis was performed to assess the lack of portal registration and use by adults (ages 18-65 years) who had visited their primary care provider within the past year, speak English, and can consent. Identified gaps discovered during analysis included lack of patient portal education, lack of standard instructions and hands-on training for patients, lack of provider (and clinical staff) education, and no portal promotion within the work environment (Eschler et al., 2016). Lack of portal registration and use is a content issue, due to a lack of information given to patients and providers about the portal. Portal use is also a context issue due to a lack of communication and promotion from staff (Nahm et al., 2017). The lack of education, communication, and promotion are discussed in both the literature review and in personal interviews conducted by the researcher (Eschler et al., 2016; Fix et al., 2016).
Literature Review
Prior to implementing the portal program, a literature review was performed using Boolean search operators, CINAHL Complete, PubMed, and Google Scholar. Search engines were queried utilizing MeSH terms, “patient portal” or “electronic health services” or “mychart” or “patient engagement,” and “web portals.” The results were 3,485 PubMed, 601 Google Scholar, and 92 CINAHL articles. Results were narrowed down using limiters: English language, articles published within the last 5 years, peer-reviewed, and full-text availability. Studies that qualified for acceptance included those that discussed patient engagement, web portals, portal adoption, and portal utilization. Additional articles chosen for acceptance included those which assessed health outcomes from portal use.
As defined by the Joanna Briggs Institute (JBI) Levels of Evidence grading tool, the highest level of evidence studies was collected to assist in identifying successful portal adoption. The collection of evidence illustrated that positive outcomes using digital health interventions was achieved by educating providers about the portal and providing patient education on portals (Nahm et al., 2017). Strong evidence utilizing a two-phase approach and a two-armed randomized control trial to test the effects of portal initiation illustrated an improvement in patient-provider communication at only four weeks. Evidence illustrated that patient education on the portal is the most important predictor of portal adoption (Nahm et al., 2017). Additional studies demonstrated that the most successful portal adoption programs had increased enrollment and activation by giving patients hands-on, one-on-one training with the portal (Shaw et al., 2017). Portal registration and utilization are demonstrated when patients are given a reason to use the portal, which leads to higher activation rates (Powell & Myers, 2018; Shaw et al., 2017).
Along with the literature review, the Agency for Healthcare Research and Quality (AHRQ) organized a 2017 national web conference on effective design and use of patient portals and their effects on patient-centered care. Portal limitations and weaknesses were addressed with the emphasis that vulnerable populations may require more one-on-one demonstrations to understand the patient portal. The conference was able to validate that patient portal initiative programs can be successful (Creber et al., 2017).
The portal initiative program aim is to increase patient engagement by 60% of participating patients within the outpatient primary care setting. The question regarding patient portals is, “In outpatient primary care adults between the ages of 18-65 years old, how does a patient portal registration and utilization program compared to no portal registration and utilization program influence patient engagement within 8 weeks?” Based on the overarching question, this article investigates patient engagement after the implementation of a patient portal initiative program.
Methods
Before project implementation, all clinic staff and providers were given education on the portal and training on educating patients about the portal over two weeks. Staff education and training included content education: portal overview, key points for patients, and how-to instructions with screenshots (Creber et al., 2017). Staff was educated on methods: inclusion criteria, portal information sheets, printed handouts, the short-version Patient Health Engagement (PHE-5) scale, and a AHRQ patient portal feedback form. At baseline, data was collected regarding portal usage trends or lack thereof, along with the average amount of unique patient logins, successful logins, failed logins, and active users. Additional information acquired included average daily no-show rates and the number of labs, appointments, referrals, and refill requests via the eClinicalWorks patient portal administration dashboard. Data measurements guided by the CMS promoting interoperability program, include a meaningful use (MU) report with the number of patients that have viewed, downloaded, and transmitted data via the portal (Shaw et al., 2017).
At the beginning of project implementation, front desk staff identified patients who fit the inclusion criteria. Patients who met the criteria were asked to join the patient portal initiative program and given an information sheet that invited the participant to join and explained the program (Nahm et al., 2017). Patients who accepted the invitation were escorted to the patient portal registration area. Patients were registered for the portal through an active e-mail address, and a portal leader was available to assist with adding the portal app to mobile devices and providing hands-on instructions through the mobile application or via laptop (Nagykaldi et al., 2012; Nahm et al., 2017). Patients who did not accept the invitation to join the portal program remained in the waiting room where marketing posters for the portal were displayed. Patients completed an engagement scale, either verbally or in writing before portal education was provided and a patient portal feedback form after hands-on education was provided (“Patient Portal Feedback Form,” 2015; Graffigna et al., 2015). At the end of the portal registration and utilization period, patients were given step-by-step portal access handouts, with screenshots of the portal and registration information for accessing the portal at home (Nahm et al., 2017). Patients could join the portal initiative program after seeing their provider if they met the inclusion criteria, even if they had initially declined.
Setting and sample
Participants of the portal initiative program were chosen via convenience sampling from an outpatient primary care clinic in Southeast Louisiana. The clinic serves a low socioeconomic patient population with four providers, seeing approximately 90- 100 patients a day. Inclusion criteria for participants included patients who were 18-65 years old, had internet access, could read and write English, had an active e-mail address, and agreed to activate the portal account. Exclusion criteria included patients who were unable to provide informed consent, read or write English, or who had previously accessed the patient portal. Patients were asked to complete the PHE-5 scale and the AHRQ patient portal feedback form during and after portal demonstration. The study was given approval by the Institutional Review Board (IRB) from the researchers’ university.
Data was collected from May 2019 to July 2019, for approximately eight weeks. A total of 233 participants completed usable PHE-5 scales during the eight-week timeframe, with the last two-weeks dedicated to calling patients for post-scale scores.
Survey instruments
The PHE-5 scale is a Likert scale that helps to measure patient engagement Graffigna et al., 2017). It consists of five ordinal items that ask participants how they feel when they think about their disease. The PHE-5 scale investigates “engagement” by evaluating multiple levels of the patients’ perception of their health (Graffigna et al., 2015). The PHE-5 scale was completed at the beginning of each patient education encounter and was given as a post-test after project completion to participants via follow up phone calls during the last two weeks of the portal program.
During the project, the AHRQ patient portal feedback form was used to assess portal usage and acceptability (“Patient Portal Feedback Form,” 2015). The AHRQ patient portal feedback form is a 10-item questionnaire created by the Agency for Healthcare Research and Quality and is utilized under the Health Literacy Universal Precautions Toolkit 2nd edition. The most important question listed on the feedback form lends to project sustainability: “Now that we have gone through the patient portal, would you use it again? If no, why not?” The AHRQ form was essential due to the shortened duration of the project and the need for feedback regarding necessary changes.
Data Collection
Portal activity was monitored, and the portal feedback form was used to guide any necessary changes that should be made either to the portal or to the program to assist in project sustainability. Data was collected and analyzed by the team leader and team members, including the clinic lead for eClinicalWorks and Healow portal system. The number of registered patients with verification via eClinicalWorks were collected and compared to the number of registered patients prior to the initiative. AHRQ feedback forms and PHE-5 scales were collected and counted to assess for patient engagement and portal feedback. Pre and post-PHE-5 scales were collected and given to a third-party statistician to assess for patient engagement. The overarching aim of increasing patient engagement by 60% of participating patients was measured via the PHE-5 scores and information collected from portal analytics. Additional factors, such as no-show rates, portal analytics, and MU metrics were collected and given to clinic administrators and providers.
Data Analysis
Data was collected using pencil and paper and entered into a Microsoft Excel® spreadsheet according to guidelines outlined by Broman & Woo (2018). Descriptive statistics were calculated – means (standard deviations) and medians (interquartile range) for quantitative data and frequencies and percentages (relative frequencies) for qualitative data.
Dependent variables were tested for normality using normal probability plots and the Anderson-Darling (AD), Shapiro-Francia (SF), and the Shapiro-Wilk (SW) normality tests (Anderson & Darling, 1954; Shapiro & Francia, 1972; Shapiro & Wilk, 1965). The Anderson-Darling test is the recommended empirical distribution function test by Stephens compared to other tests of normality giving more weight to the tails of the distribution than the Cramer-von Mises test (Stephens, 1986).
The Shapiro-Francia test was chosen because of its known performance and the Shapiro-Wilk test was chosen because it is one of the best-known tests for normality (Shapiro & Wilk, 1965; Stephens, 1986). Yap and Sim (2011) demonstrated the Shapiro- Wilk test performs well for alternate symmetric short-tailed distributions (Ahmad & Khan Sherwani, 2015; Yap & Sim, 2011). It has also been noted the Shapiro-Wilk test is most powerful against alternatives with the support (0, ∞) and is also powerful if the assumed alternative distributions are asymmetric on the interval (-∞, ∞) giving better results for sample sizes three to 5000 (Ahmad & Khan Sherwani, 2015; Shapiro & Wilk, 1965). The Shapiro-Wilk test is the most powerful test for data subscribing to a Weibull distribution (Ahmad & Khan Sherwani, 2015). The Shapiro-Francia test performs well under a Cauchy distribution at the five percent level, whereas at a one percent level of significance it performs equally well as the Anderson-Darling and Cramer-von Mises test (Ahmad & Khan Sherwani, 2015).
The Shapiro-Francia and the Shapiro-Wilk tests are correlational tests based on the ratio of two weighted least-squares estimates of scale obtained from order statistics (Dufour et al., 1998; Shapiro & Francia, 1972; Shapiro & Wilk, 1965). The two estimates of the tests are the normally distributed weighted least squares estimates using population and sample variance estimates. In a comparison of normality tests, the Shapiro-Francia test consistently ranked as one of the most powerful normality tests for Cauchy, exponential, log- normal, and g (2,2) distributions for sample sizes between 25 and 200 (Střelec, 2008). Goodness- of-fit testing used an a priori alpha level of .05. Parametric methodology was used for data found to be normally distributed and either nonparametric methodology were used for data judged not to be normally distributed or a rank transformation was done (Conover & Iman, 1976, 1981; Conover & Inman, 1979).
Owning to the dependence of the data, a one-sided test [paired t test or Wilcoxon Signed Rank test; (Student, 1908; Wilcoxon, 1945)] was used to identify increases in posttest scores at an a priori alpha level of .05 (Wilcoxon, 1945) The paired t test detects an increase in means, and the Wilcoxon Signed Rank test examines whether there is a shift in location due to the intervention (Hollander & Wolfe, 1999). Since there was an interest in scores increasing after the intervention, a one-sided test was used instead of a two-sided test.
One of the chief assumptions in linear regression is the independence of observations.
This assumption, like some assumptions, is not robust to violation. When multiple observations are taken on one study subject, these observations are more closely correlated than observations that are not related. To account for this, different methodology must be used. For continuous dependent variables, the appropriate methodology is linear mixed models (Laird & Ware, 1982; Zeger & Liang, 1986) and for data that is not continuous, such as binary outcomes, the generalized linear mixed model is appropriate (Liang & Zeger, 1986; Zeger & Liang, 1986; Zeger et al., 1988). The linear mixed model (LMM) and generalized linear mixed model (GLMM) are especially useful in analyzing longitudinal data (multiple observations on the same study subject), offering numerous advantages over repeated measures methodology, but are also useful in multilevel models (also known as hierarchical linear models; HLM) where one might have participants at several sites and data are nested.
A likelihood ratio test approach was used for model building. The likelihood ratio test (LRT) compares the goodness-of-fit of two nested models where one model (null model) is a special case of the other (alternative) model. For example, if the alternative model is Y=X1+X2+X3, we may wish to test the effect of X3 and thus compare it to the null model of Y=X1+X2. The test is based on the likelihood ratio, which expresses how many times more likely the data are under one model than the other. This likelihood ratio, or equivalently its logarithm, can then be used to compute a P value to reject the null model in favor of the alternative model; in other words, one should reject the simpler model in favor of a more complex model. Use of the likelihood ratio test can be justified by the Neyman–Pearson lemma, which shows such a test has the highest power among all competitors (Neyman & Pearson, 1933). When examining outcomes, it is desirable to arrive at a prediction model that explains the outcome adequately but does not needlessly complicate the model (parsimony). Model building is perhaps one of the most complicated, and contentious, subject matters in statistics. There are numerous methods for model building, including best subsets regression, stepwise regression, forward selection, and backward selection. In this study, variable selection was done by hand and the likelihood ratio test.
However, one must still posit, when a variable is included or dropped from a model. Hocking suggests using ??=.15, as this is widely adopted and cited in the literature (Hocking, 1976). Use of a more traditional and conservative alpha level such as ??=.05 may result in failing to identify variables known to be important (Bendel & Afifi, 1977; Mickey & Greenland, 1989). An ??=.15 was used for model building and an a priori ??=.05 was used for significance testing. Researchers note a likelihood ratio testing approach generalizes to longitudinal mixed models (Bolker et al., 2009; Pinheiro & Bates, 2000). Analyses were done using R v3.5.2.
The common language effect size (CL) is the preferred effect size for a paired nonparametric analysis. The CL, also referred to as the probability of superiority by Grissom and Kim, PSDep can be modified as an effect size for Wilcoxon Signed-rank test (Grissom & Kim, 2012). To calculate the CL for paired data, one must subtract the initial values from the second values observed and count the number of positive values. Then divide the number of positive values by the number of observations (study subjects) in the data set. This makes the percentage of observations in the “post-treatment period” greater than the pretreatment period. The interpretation of PSDep is that PSDep*100% of the data in the post-intervention are greater than the pre-intervention condition.
In April 2019, the American Statistical Association formally suggested the term “statistical significance” be abandoned along with the terms “significantly different,” “p<0.05,” and “nonsignificant.” Wasserstein and colleagues continue imploring researchers to remove these terms and similar terminology in favor of reporting exact p values and interpreting differences from a practical perspective (Wasserstein et al., 2019). Considering this formal stance by the American Statistical Association, no interpretation of statistical significance will be made.
Results
Data were collected using pencil and paper and entered into a Microsoft Excel® spreadsheet according to guidelines outlined by Broman & Woo (2018). Data were then read into SPSS and saved to an SPSS system file. Lastly, collected data were then transferred to the statistician for analysis. Data were read into R and analyzed.
Two hundred thirty-three participants were enrolled in the study. Five participants (2%) were excluded as they were not first-time users of the portal leaving an analyzable cohort of 228 participants. The mean age of the cohort was 46 years (SD=13.0) and a median age of 49 years (IQR=19.0). Instrument responses were converted to an ordinal scale for analysis. Means and medians of all five pre-intervention PHE questions were about 5. Standard deviations of all five PHE questions were about 2.0 with the exception of interquartile ranges for Question 3 and Question 4 (Table 1).
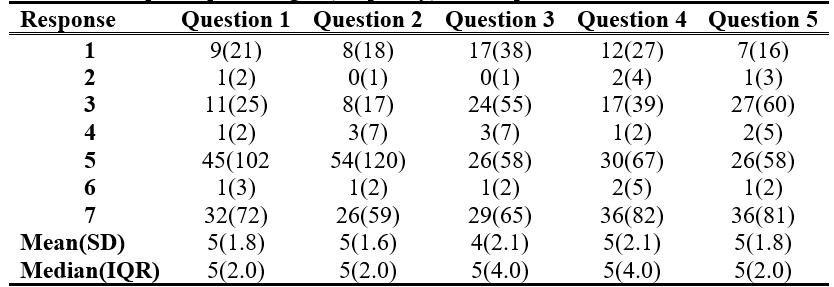
Table 1. PHE-5 response percentages (frequency) for the pre-intervention test
Mean responses for Questions 1 and 2 increased by 1 point and standard deviations decreased by about 20% and median values increased by 2 points for Questions 1 and 2 while medians for Questions 3 through 5 remained unchanged. Interquartile ranges were halved for Questions 3 and 4 (Table 2.).
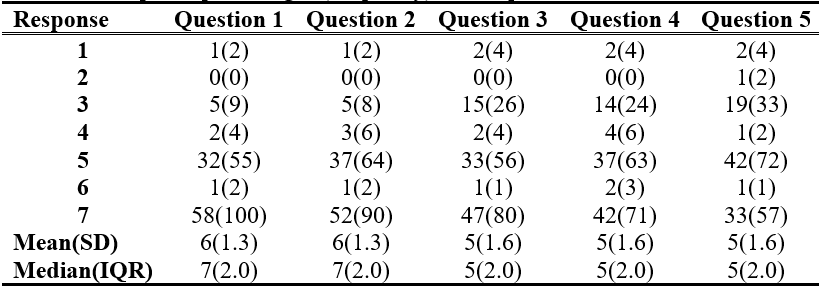
Table 2. PHE-5 response percentages (frequency) for the post-intervention test
All questions were tested using normal probability plots and the Anderson-Darling, Shapiro-Francia, and Shapiro-Wilk normality tests (Anderson & Darling, 1954; Shapiro & Francia, 1972; Shapiro & Wilk, 1965). No questions were judged to be normally distributed (P value<.0001 for all tests for all questions). Therefore, the Wilcoxon Signed Rank test was used to detect differences in each question, and dependent variables were rank transformed for the linear mixed model analysis and testing which variables were important contributors to question scores.
In univariate analyses, there were important increases detected in Questions 1 through 3 (P value<.0001). Question 4 (P value=.0002) and Question 5 (P value=.0492) also showed important difference in posttest values. Likelihood ratio testing was performed using rank transformed questions (Question 1 through 5) and a random intercept term, time, age, and usage of the patient portal. Age appeared to be an important predictor of Question 1 PHE score; however, usage was not an important predictor of Question 1 PHE score (P value=.2492). Age adjustment did not vary the univariate results of the pre-intervention/post-intervention results (P value<.0001). Similar results were also seen for Question 2. Usage was not an important variable (P value= .3445); however, age was an important variable (P value= .0339). Again, there were important pre-intervention/post-intervention differences after age adjustment – no difference from the univariate results. Usage was an important variable to consider (P value= .1048) when looking at Question 3 results and age was not (P value= .2109). There were important pre- intervention/post-intervention results (P value<.0001) and important portal use results (P value=.0620). Portal use was not an important variable (P values= .7426), and neither was age (P value= .9715) when looking at Question 4. The results of the model were virtually unchanged from the univariate results (P value=.0027). Similar results were seen for Question 5; portal use< (P value=.6972) and age (P value=.4307) were not important variables when considering Question 5 PHE score. In summary, it is important to adjust for age in Questions 1 and Question 2, and it is important to adjust for portal usage in Question 3. Questions 4 and 5 do not need adjustment for age or portal usage.
The PSDep was calculated for each of the questions. Seventy percent of those post-intervention scored higher than pre-intervention scores. This can be thought of as a strong effect size. Similarly, Questions 2 and 3 had moderate to strong effect sizes (PSDep=.6 and PSDep=.7, respectively). However, the effect size for Question 4 was .5 of 50%. This is the null value for the PSDep and is equivalent to a coin flip, where half the post-intervention values saw an increase and half saw a decrease negating the hypothesis testing results. The hypothesis tests revealed an important increase in Question 4 scores, but the effect size does not support there being an important difference. Finally, Question 5 revealed a PSDep=.4; 40% of the post-intervention scores were higher than the pre- intervention scores. Said another way, 60% of the pre-intervention scores were higher than the post-intervention scores. Again, these are results that contradict what was seen in the univariate analyses.
Prior to portal initiation, portal analytics showed an average of 15.5 new portal registrations per month over the previous six months. After the portal initiative, an increase in portal registrations of 261% (n=56) occurred for the month of May and an increase of 1,197% (n=201) during the month of June. The average amount of “active portal users” increased by 156% (n=70) in May and 727% (n=226) in June. The number of logins increased in conjunction with the increase in portal users. An average of 239 logins a month increased to 492 logins in May and 916 logins in June.
Objectives of the portal initiative program were to demonstrate a 70% increase in patient portal registration of patients during the eight-week timeline, which was met and exceeded.
Additional objectives included achieving an 80% completion of the AHRQ form in participating patients. The study had a 92.5% response rate on the AHRQ form. Lastly, the third objective and overall aim of the portal initiative program was to increase patient engagement by 60% of the participating patients through the PHE-5 scale. Operationalizing patient engagement was completed through the PHE-5 scale. By using the PHE-5 scale as a metric, the objective of patient engagement as a gestalt was met as three of the five scales showed an increase 3/5=.60*100=60%.
Additional positive findings of the portal initiative program included an increase in both web-enabled patients and active/inactive users. Prior to portal initiation, 3,259 patients were web-enabled compared to the current number of 3,535. Numbers from before and after project initiation show a total of 276 new web-enabled patients, with only 233 participants registering through the portal program. The difference found demonstrates that 43 patients self-registered without going through the portal initiative program. The increase in web-enabled patients can be attributed to marketing posters and provider encouragement, which lends credibility to project sustainability. Secure messaging, refill and referral requests, and laboratory result delivery also increased with portal implementation.
To assess for project sustainability, two months after the initiative ended portal measurements were re-collected which showed a 10% growth in new portal users. Patient- provider communication via the portal showed an 853% increase (54 outgoing messages) and 208% increase (inbox messages) two months post-project. Furthermore, a small percentage of patients linked smart devices and/or manually added their health information into their portal,including blood pressures, heart rates, blood sugar readings, and health data, not covered in the hands-on demonstration. The increase in health information transfer was an extraordinary finding, as no patient had ever entered health information into the portal prior to the portal initiative.
Collected AHRQ portal feedback forms illustrated that over 75% of the participants reported no previous knowledge of the portal. Furthermore, most patients reported liking the appearance of the portal and feeling it was easy to access. However, some patients stated that they would like an explanation of abnormal laboratory results or an eHealth “dictionary” that could explain unfamiliar medical terms, such as HCT for hematocrit.
Discussion
The portal initiative program increased patient portal registration by 70% during the eight- week timeline. Using the PHE-5 scale as a metric, an increase in patient engagement of 60% was found, as three of the five scales showed an increase in engagement. Portal registrations increased by 1,197% during portal promotion and remained elevated at two months post- initiative. Patient-provider communication via portal increased substantially, along with lab views and refill requests, even after project completion. The increase in patient engagement and portal analytics gives credibility to portal initiative programs and their ability to foster engagement.
Similarities between the portal initiative program and the literature include the importance of portal marketing and provider promotion and its effect on portal adoption (Nahm et al., 2017). Additional findings include the importance of hands-on, face-to-face portal promotion with a positive relationship to portal adoption (Eschler et al., 2016). As demonstrated in the literature, the use of mobile access to the patient portal significantly increased patient adoption (Pho et al., 2019).
The portal initiative program was founded in the Empowerment Informatics Framework because of its reputation in promoting health technology through patient-empowered tools (Knight & Shea, 2014). The implementation of a patient portal encourages patients to engage in their health care choices and allows them to make better decisions regarding their care. As the initiative program increased portal users, providers saw an increase in patient engagement, most notably through secure messaging and refill requests. Therefore, adoption of the Empowerment Informatics Framework greatly contributed to the success of the initiative program.
Limitations
As with all studies, this investigation has its limitations. One limitation is the meaning of the increases seen in all PHE questions from pre-intervention to post-intervention. Although retrospective power studies are discouraged, in this case, retrospective sample size calculations were conducted to investigate if the study was overpowered (Gilbert & Prion, 2016). Sample size calculations demonstrated 42 participants were needed to achieve 82% power. Accounting for the number of observations that did not answer pre-intervention questions and post-intervention questions, the estimated sample size does not exceed 70. Therefore, we must temper the results seen in this study with the knowledge that it is overpowered.
Additional barriers to the project included having many patients that did not meet the inclusion criteria due to lack of internet access or e-mail address. Furthermore, intermittent loss of internet service within the facility caused delays in portal registration. Additional findings reported were linked to comprehension of the PHE-5 scale. Patients struggled with terminology such as “blackout”, “serene”, and “coherence.” Although the PHE-5 scale was tested by Graffigna et al., (2017), which resulted in high validity and reliability, the study participants exhibited low health literacy. Therefore, statistics completed on results may vary in reliability due to patients avoiding these terms. Recommendations for further research would be to include a script or examples to explain words that the patient population may not understand. Additionally, project length would be expanded greater than eight weeks, to provide access for patient engagement over a longer length of time.
Conclusions
Implementation of the patient portal initiative was found to be successful in increasing registration and adoption of the patient portal by participants. Patients reported increased knowledge of conditions and increased satisfaction with being able to see laboratory results and communicate more effectively with their providers. Marketing portal availability via clinic staff, providers, and posters was effective in increasing participation. Although no monetary or physical incentives were offered for this study, future studies could implement incentives, such as gift card promotions, to increase patient enrollment. The use of a portal leader to assist patients in setting up the portal application on their phones and demonstrating its use was a factor in the increasing portal registration numbers.
Clinical relevance statement
Increasing patient engagement via patient portal usage is pertinent to advanced practice nurses in the outpatient family practice setting because it promotes better health outcomes (Creber et al., 2017; Nahm et al., 2017; Price-Haywood et al., 2017).
Implementing the patient portal initiative program can impact the way care is delivered by allowing patients to have better access to their providers and greater transparency in their health.
Involvement of human subjects
The investigators have conducted the experiment after receiving appropriate approval from the IRB of the institution (IRB Exempt). Therefore, all the required ethics and standards have been followed. Informed consent was acquired from all portal participants.
Declaration of conflicting interests
The author(s) declared no potential conflicts of interest concerning the research, authorship, and/or publication of this article.
Funding
The author(s) received no financial support for the research, authorship, and/or publication of this article.
Online Journal of Nursing Informatics
Powered by the HIMSS Foundation and the HIMSS Nursing Informatics Community, the Online Journal of Nursing Informatics is a free, international, peer reviewed publication that is published three times a year and supports all functional areas of nursing informatics.
References & Bios
Ahmad, F., & Khan Sherwani, R. A. (2015). Power comparison of various normality tests.
Pakistan Journal of Statistics and Operation Research, 11(3), 331–345. https://doi.org/10.18187/pjsor.v11i3.845
Anderson, T. W., & Darling, D. A. (1954). A test of goodness-of-fit. Journal of the American Statistical Association, 49(268), 765–769. https://doi.org/10.1080/01621459.1954.10501232
Bendel, R. B., & Afifi, A. A. (1977). Comparison of stopping rules in forward stepwise regression. Journal of the American Statistical Association, 72(357), 46–53. https://doi.org/10.2307/2286904
Bolker, B. M., Brooks, M. E., Clark, C. J., Geange, S. W., Poulsen, J. R., Stevens, M. H. H., & White, J.-S. S. (2009). Generalized linear mixed models: A practical guide for ecology and evolution. Trends in Ecology & Evolution, 24(3), 127–135. https://doi.org/10.1016/j.tree.2008.10.008
Broman, K. W., & Woo, K. H. (2018). Data organization in spreadsheets. The American Statistician 78, 2–10 (doi:10.1080/00031305.2017.1375989)
Caldwell, H. D., Minkoff, N. B., & Murthy, K. (2017). Patient web portals and patient-provider relationships: A summary perspective. International Journal of Technology Assessment in Health Care, 33(1), 63–68. https://doi.org/10.1017/S0266462317000137
Conover, W. J., & Iman, R. L. (1976). On some alternative procedures using ranks for the analysis of experimental designs. Communications in Statistics - Theory and Methods, A5(14), 1349–1368.
Conover, W. J., & Iman, R. L. (1981). Rank transformations as a bridge between parametric and
nonparametric statistics. The American Statistician, 35(3), 124–129. https://doi.org/10.2307/2683975
Conover, W. J., & Inman, R. L. (1979). On multiple-comparisons procedures. Los Alamos Scientific Laboratory.
Creber, R., Lyles, C., & Ancker, J. (2017). A national web conference on effective design and use of patient portals and their impact on patient-centered care. Agency for Healthcare Research and Quality. https://digital.ahrq.gov/sites/default/files/docs/impact-pcc-slides-032…
Donnelly, P., & Kirk, P. (2015). Use the PDSA model for effective change management.
Education for Primary Care, 26(4), 279–281. https://doi.org/10.1080/14739879.2015.11494356
Dufour, J. M., Farhat, A., Gardiol, L., & Khalaf, L. (1998). Simulation-based finite sample normality tests in linear regressions. The Econometrics Journal, 1(1), C154–C173.
Eschler, J., Meas, P. L., Lozano, P., McClure, J. B., Ralston, J. D., & Pratt, W. (2016).
Integrating the patient portal into the health management work ecosystem: user acceptance of a novel prototype. AMIA ... Annual Symposium Proceedings. AMIA Symposium, 2016(1), 541–550.
Esmaeilzadeh, P., & Sambasivan, M. (2016). Health Information Exchange (HIE): A literature review, assimilation pattern and a proposed classification for a new policy approach.
Journal of Biomedical Informatics, 64, 74–86. https://doi.org/10.1016/j.jbi.2016.09.011
Fiks, A. G., DuRivage, N., Mayne, S. L., Finch, S., Ross, M. E., Giacomini, K., Suh, A., McCarn, B., Brandt, E., Karavite, D., Staton, E. W., Shone, L. P., McGoldrick, V., Noonan, K., Miller, D., Lehmann, C. U., Pace, W. D., & Grundmeier, R. W. (2016). Adoption of a portal for the primary care management of pediatric asthma: A mixed-methods implementation study. Journal of Medical Internet Research, 18(6), 1–18. https://doi.org/10.2196/jmir.5610
Fix, G. M., Hogan, T. P., Amante, D. J., McInnes, D. K., Nazi, K. M., & Simon, S. R. (2016). Encouraging patient portal use in the patient-centered medical home: Three stakeholder
perspectives. Journal of Medical Internet Research, 18(11). https://doi.org/10.2196/jmir.6488
Fleming, N. L., Cullen, D., & Luna, G. (2015). An Evaluation of Patient Web Portal Engagement: An Exploratory Study of Patients with Hypertension and Diabetes. Online Journal of Nursing Informatics, 19(3).
Francis, I. (2017). Nursing informatics and the metaparadigms of nursing. Online Journal of Nursing Informatics, 21(1).
Gilbert, G. E., & Prion, S. K. (2016). Making sense of methods and measurement: The danger of the retrospective power analysis. Clinical Simulation in Nursing, 12(8), 303–304. https://doi.org/10.1016/j.ecns.2016.03.001
Graffigna, G., Barello, S., & Bonanomi, A. (2017). The role of Patient Health Engagement model (PHE-model) in affecting patient activation and medication adherence: A structural equation model. PLoS ONE, 12(6). https://doi.org/10.1371/journal.pone.0179865
Graffigna, G., Barello, S., Bonanomi, A., & Lozza, E. (2015). Measuring patient engagement: Development and psychometric properties of the Patient Health Engagement (PHE) Scale. Frontiers in Psychology, 6, 274. https://doi.org/10.3389/fpsyg.2015.00274
Grissom, R. J., & Kim, J. J. (2012). Effect sizes for ordinal categorical variables. In Effect Sizes for Research: Univariate and Multivariate Applications (2nd ed.). Routledge.
Hess, C. T. (2019). Merit-based Incentive Payment System 2019: Promoting Interoperability
Details and Measures. Advances in Skin and Wound Care, 32(4), 191–192. https://doi.org/10.1097/01.ASW.0000554311.30302.68
Higgins, T., Larson, E., & Schnall, R. (2017). Unraveling the meaning of patient engagement: A concept analysis. Patient Education and Counseling, 100(1), 30–36. https://doi.org/10.1016/j.pec.2016.09.002
Hocking, R. R. (1976). The analysis and selection of variables in linear regression. Biometrics, 32(1), 1–49.
Hollander, M., & Wolfe, D. A. (1999). Nonparametric statistical methods (2nd ed.). Wiley.
Irizarry, T., De Vito Dabbs, A., & Curran, C. R. (2015, June 1). Patient portals and patient engagement: A state of the science review. Journal of Medical Internet Research, 17, e148. https://doi.org/10.2196/jmir.4255
Knight, E. P., & Shea, K. (2014). A patient-focused framework integrating self-management and informatics. Journal of Nursing Scholarship, 46(2), 91–97. https://doi.org/10.1111/jnu.12059
Kruse, C. S., Bolton, K., & Freriks, G. (2015, February 1). The effect of patient portals on quality outcomes and its implications to meaningful use: A systematic review. Journal of Medical Internet Research, 17. https://doi.org/10.2196/jmir.3171
Lafata, J. E., Miller, C., Shires, D., Dyer, K., Ratliff, S., & Schreiber, M. (2018). Patients’ adoption of and feature access within electronic patient portals. The American Journal of Managed Care, 24(11). https://www.ajmc.com/journals/issue/2018/2018- vol24-n11/patients-adoption-of-and-feature-access-within-electronic-patient-portals
Laird, N. M., & Ware, J. H. (1982). Random-effects models for longitudinal data. Biometrics,
38(4), 963–974. https://doi.org/10.2307/2529876
Liang, K.-Y., & Zeger, S. L. (1986). Longitudinal data analysis using generalized linear models.
Biometrika, 73(1), 13–22. https://doi.org/10.1093/biomet/73.1.13
Lyles, C. R., Sarkar, U., Schillinger, D., Ralston, J. D., Allen, J. Y., Nguyen, R., & Karter, A. J. (2016). Refilling medications through an online patient portal: Consistent improvements in adherence across racial/ethnic groups. Journal of the American Medical Informatics Association, 23(e1), 28–33. https://doi.org/10.1093/jamia/ocv131
Mickey, R. M., & Greenland, S. (1989). The impact of confounder selection criteria on effect estimation. American Journal of Epidemiology, 129(1), 125–137.
Nagykaldi, Z., Aspy, C. B., Chou, A., & Mold, J. W. (2012). Impact of a wellness portal on the delivery of patient-centered preventive care. Journal of the American Board of Family Medicine, 25(2), 158–167. https://doi.org/10.3122/jabfm.2012.02.110130
Nahm, E. S., Diblasi, C., Gonzales, E., Silver, K., Zhu, S., Sagherian, K., & Kongs, K. (2017). Patient-centered personal health record and portal implementation toolkit for ambulatory clinics: A feasibility study. CIN - Computers Informatics Nursing, 35(4), 176–185. https://doi.org/10.1097/CIN.0000000000000318
Neyman, J., & Pearson, E. S. (1933). On the problem of the most efficient tests of statistical hypotheses. Philosophical Transactions of the Royal Society of London. Series A, Containing Papers of a Mathematical or Physical Character, 231, 289–337.
Otte-Trojel, T., De Bont, A., Van De Klundert, J., & Rundall, T. G. (2014). Characteristics of patient portals developed in the context of health information exchanges: Early policy effects of incentives in the meaningful use program in the United States. Journal of Medical Internet Research, 16(11). https://doi.org/10.2196/jmir.3698
Patient Portal Feedback Form. (2015). Agency for Healthcare Research & Quality https://www.ahrq.gov/health-literacy/improve/precautions/tool17b.html
Pho, K. K., Lu, R., Gates, S., Cai, J., Xie, D., Xie, Y., … Gerber, D. E. (2019). Mobile Device Applications for Electronic Patient Portals in Oncology. https://doi.org/10.1200/CCI.18
Pinheiro, J., & Bates, D. (2000). Mixed-Effects Models in S and S-PLUS. Springer.
Powell, K. R., & Myers, C. R. (2018). Electronic Patient Portals: Patient and Provider
Perceptions. Online Journal of Nursing Informatics, 22(1).
Price-Haywood, E. G., Harden-Barrios, J., Ulep, R., & Luo, Q. (2017). EHealth Literacy: Patient Engagement in Identifying Strategies to Encourage Use of Patient Portals Among Older Adults. Population Health Management, 20(6), 486–494. https://doi.org/10.1089/pop.2016.0164
Rodriguez, E. S. (2018). Using Patient Portals to Increase Engagement in Patients with Cancer.
Seminars in Oncology Nursing, 34(2), 177–183. https://doi.org/10.1016/j.soncn.2018.03.009
Sawesi, S., Rashrash, M., Phalakornkule, K., Carpenter, J. S., & Jones, J. F. (2016). The Impact of Information Technology on Patient Engagement and Health Behavior Change: A Systematic Review of the Literature. JMIR Medical Informatics, 4(1), e1. https://doi.org/10.2196/medinform.4514
Schnall, R., Rojas, M., Bakken, S., Brown, W., Carballo-Dieguez, A., Carry, M., … Travers, J. (2016). A user-centered model for designing consumer mobile health (mHealth) applications (apps). Journal of Biomedical Informatics, 60, 243–251. https://doi.org/10.1016/j.jbi.2016.02.002
Shapiro, S. S., & Francia, R. S. (1972). An approximate analysis of variance test for normality.
Journal of the American Statistical Association, 67(337), 215–216. https://doi.org/10.1080/01621459.1972.10481232
Shapiro, S. S., & Wilk, M. B. (1965). An analysis of variance test for normality (complete samples). Biometrika, 52(3–4), 591–611. https://doi.org/10.1093/biomet/52.3-4.591
Shaw, C. L., Casterline, G. L., Taylor, D., Fogle, M., & Granger, B. (2017). Increasing health portal utilization in cardiac ambulatory patients: A pilot project. CIN - Computers Informatics Nursing, 35(10), 512–519. https://doi.org/10.1097/CIN.0000000000000361
Stephens, M. A. (1986). Tests based on EDF statistics. In M. D’Agostino, Ralph B and Stephens (Ed.), Goodness-of-Fit Techniques. Marcel Dekker.
Střelec, L. (2008). Comparison of power of modified Jarque-Bera normality tests and selected tests of normality. Acta Universitatis Agriculturae et Silviculturae Mendelianae Brunensis, 56(6), 137–147.
Student. (1908). The probable error of the mean. Biometrika, 6(1), 1–25.
Wasserstein, R. L., Schirm, A. L., & Lazar, N. A. (2019). Moving toward a world beyond “p<0.05.” The American Statistician, 73(sup1), 1–19. https://doi.org/10.1080/00031305.2019.1583913
Wilcoxon, F. (1945). Individual comparisons of grouped data by ranking methods. Biometrics Bulletin, 1(6), 80–83. https://doi.org/10.2307/3001968
Wildenbos, G. A., Peute, L., & Jaspers, M. (2017). Facilitators and Barriers of Electronic Health Record Patient Portal Adoption by Older Adults: A Literature Study. Studies in Health Technology and Informatics, 235, 308–312. https://doi.org/10.3233/978-1-61499-753-5-308
Yap, B. W., & Sim, C. H. (2011). Comparisons of various types of normality tests. Journal of
Statistical Computation and Simulation, 81(12), 2141–2155. https://doi.org/10.1080/00949655.2010.520163
Zeger, S. L., & Liang, K. Y. (1986). Longitudinal data analysis for discrete and continuous outcomes. Biometrics, 42(1), 121–130. https://doi.org/10.2307/2531248
Zeger, S. L., Liang, K. Y., & Albert, P. S. (1988). Models for longitudinal data: a generalized estimating equation approach. Biometrics, 44(4), 1049–1060. https://doi.org/10.2307/2531734
Zhao, J. Y., Song, B., Anand, E., Schwartz, D., Panesar, M., Jackson, G. P., & Elkin, P. L. (2017). Barriers, Facilitators, and Solutions to Optimal Patient Portal and Personal Health Record Use: A Systematic Review of the Literature. AMIA ... Annual Symposium Proceedings. AMIA Symposium, 2017, 1913–1922.
Author Biography:
Kimberly Poussard, MSN, FNP-C is a doctoral student at the University of South Alabama and dedicated nurse practitioner in the field of emergency medicine.
Casey Elkins, DNP, Med, NP-C, CLS, FNLA is Assistant Dean for Academic Affairs and Associate Professor of Nursing in the College of Nursing, University of South Alabama.
Gregory E. Gilbert, EdD, MSPH, PStat® is owner of owner SigmaStats© Consulting, LLC. a statistical consulting firm specializing in consulting with DNP students and in game-based learning.