Emerging Technologies

Every one of us has had the same experience: We enter the exam room, plop down on the crinkly paper on the weird cold vinyl-covered table-chair and stick out our arm for the medical professional to slide a cuff onto, pump it up (or let it pump itself), and record two simple numbers; 120/80 (“One-twenty over eighty”) if we’re lucky. Maybe they’re scribbled it on a piece of paper or typed into a computer. Perhaps the numbers even flow directly into the computer. Nonetheless, almost no one thinks about what it takes for something as simple as two integers and a punctuation mark to be recorded as part of a patient’s record, how all of this connects to technology that is hundreds of years old, and how it is recorded in a way that will make it useful in the future.
Doug Meil submitted the following article on the history and complexities of those two simple numbers, and it serves as a reminder of all the effort that HIMSS members put forth daily as we strive to reform the global health ecosystem through the power of information and technology. The next time you look at your own medical record, remember to think of the informaticists toiling behind the scenes to make each and every one of those numbers, notes, images, and other data get to where it’s needed.
Non-Obvious Ways Medical Data Is Hard: Blood Pressure
It should not surprise anyone to learn that medical data is complex. Tests such as Magnetic Resonance Imaging (MRI), Computed Tomography (CT), and Positron Emission Tomography (PET) have all come about through significant advances in electrical engineering, mechanical engineering, computer engineering, and computer science, to name a few of the disciplines involved. Even older tests like the Electrocardiogram (EKG) continue to be advanced through automated analysis and interpretation, and the X-ray (which dates to the 19th century) has been reimagined in clinical workflows with digital imaging. This post is about how a vital measurement that is easy to take for granted, blood pressure, has health informatics complexity that people both outside, and inside, of the healthcare industry may not be aware of.
Brief History of Blood Pressure Measurement
An accurate method to record blood pressure was an open clinical research problem in the latter half of the 19th century and up to the early 20th century. The methods can be broadly separated into two categories: the Sphygmograph (external weights applying pressure to weights on the radial artery), and the Sphygmomanometer (the cuff method we are now familiar with). As with all new technologies, the early versions of both were awkward to use and inaccurate, but they did produce new data where none was previously available. The details of each new advancement are beyond the scope of this article, but just looking through the highlights shows that it took significant time and effort to get where we are today.
- Sphygmograph
-
- Sphygmograph (Marey) - 1860
- Sphygmograph (Dudgeon) – 1882
- Now it’s portable!
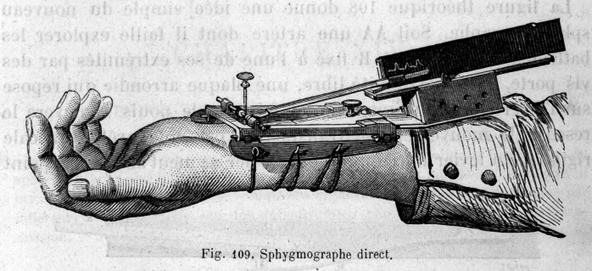
Image: Sphygmograph (Wikipedia)
- Sphygmomanometer
- Sphygmomanometer (von Basch) – 1881
- Sphygmomanometer (Potain) – 1891
- Sphygmomanometer (Riva-Rocci) – 1896
- Sphygmomanometer (Cushing) – 1901
- This is where measurement became accurate and practical
- Sphygmomanometer (Korotkoff) – 1905
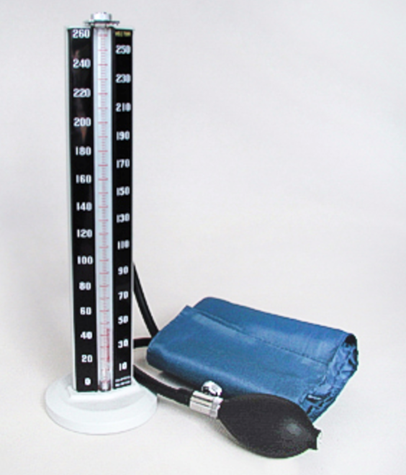
Image: Sphygmomanometer - Clinical Mercury Mamometer (Wikipedia)
Complexities For Health Informatics Over Time
We have been conditioned today to consider blood pressure effectively as a blob of text: “120/80”, for example. But how did it get that way?
Invention of the Sphygmograph
The Sphygmograph was an important device for its time and literally means “pulse writer.” The output of the device is a pulse wave traced on paper, which can be used to record and interpret the rapidity, strength, and uniformity of the arterial pulse. Pulse-reading had been a part of medicine for thousands of years and the Sphygmograph was able to produce a new visualization of the pulse that was previously unavailable. The problem is that the output was effectively still qualitative and subjective given technical limitations, and the resulting data points were arguably the same ones previously available when the pulse was measured by hand, except now there was a paper tracing for the patient’s file. When modeled as a FHIR Observation, the results would look as follows:
Observation
|
Patient |
Date |
ObsType |
ValueStr |
|
123 |
June 1, 1878 |
Pulse.rapidity |
Fast |
|
123 |
June 1, 1878 |
Pulse.strength |
Strong |
|
123 |
June 1, 1878 |
Pulse.uniformity |
Uniform |
An 1873 article in Nature said:
“The sphygmograph, shortly after its first construction, was introduced into this country as an instrument which gave promise of being an invaluable aid in diagnosis, and of such universal applicability as the stethoscope and thermometer. Nevertheless, after an existence of more than ten years, it may be said that the general impression respecting it is that it is a failure, that it has not answered its expectations, and that it may as well be put aside, together with other curiosities of the physiological laboratory.”
This commentary would indicate that by 1873 the instrument was in the “Trough of Disillusionment” in Gartner’s hype-cycle. One should not be too hard on the Sphygmograph, however, as advances in medicine are not easy, and they often rely on learning from prior experiments and experiences. Someone or something has to go first, which was the Sphygmograph’s role.
Invention of Sphygmomanometer
The Sphygmomanometer started measuring blood pressure as we recognize it today, but with some caveats. For starters, when the Sphygmomanometer was invented, it could only measure one blood pressure value – the systolic blood pressure, which is the pressure exerted against the artery walls when the heart beats pumping blood out. Knowing healthcare data management preferences for shortcuts, it wouldn’t surprise me that if a 19th century electronic medical record had existed that the ObservationType associated to the record was recorded as just “BloodPressure” – since systolic that was the only type of blood pressure capable of being measured at that time.
As with many initial attempts, there were also accuracy issues with the Sphygmomanometer. For example, in the data below which is the accurate blood pressure reading? It is tempting to go with averages and just pick the middle-value. But given the limited amount of data points it is not clear what the true value really is, and the device could just as easily be generating high-side or low-side readings. It is always exciting from a health informatics standpoint to get new data where none was previously available, but sometimes it takes a while to work out the kinks.
Observation
|
Patient |
Date |
ObsType |
ValueStr |
ValueNum |
UOM |
|
123 |
June 1, 1882 |
BloodPressure |
|
135 |
mm Hg |
|
123 |
July 1, 1882 |
BloodPressure |
|
105 |
mm Hg |
|
123 |
Aug 1, 1882 |
BloodPressure |
|
120 |
mm Hg |
Also worth noting is that the unit of measurement for the values is millimeters of Mercury (mm Hg). That unit is tied to the first implementations of the sphygmomanometer which literally measures pressure in millimeters of Mercury rising in a column in the device. The reason why a substance as dangerous and toxic as Mercury became integral to one of the core measurements of cardiovascular health is because Mercury is very dense. Denser liquids will more easily fluctuate with pressure changes giving the provider a more accurate reading. That would not be possible using another fluid such as water, at least not with a device the same size that fits on a countertop. The use of Mercury for such measurement dates to the 17th century with the study of atmospheric pressure.
Change in Sphygmomanometer Models
It was not until about 1901 that that the measurement of blood pressure was considered accurate enough for common usage. A single patient during that era could have had their blood pressure measured and recorded with at least four different major versions of the Sphygmomanometer, so it would be beneficial for data integrity and lineage purposes to record the device-type in the Observation record as well. Recording the device is something that lab results (which are also modeled as FHIR Observations) take for granted, but most people are not accustomed to recording this level of detail for vitals, as they are often viewed as being so simple.
Observation
|
Patient |
Date |
ObsType |
ValueStr |
ValueNum |
UOM |
Device |
|
123 |
June 1, 1882 |
BloodPressure |
|
135 |
mm Hg |
Von Basch |
|
123 |
July 1, 1882 |
BloodPressure |
|
105 |
mm Hg |
Von Basch |
|
123 |
Aug 1, 1882 |
BloodPressure |
|
120 |
mm Hg |
Von Basch |
|
… |
|
|
|
|
|
|
|
123 |
June 1, 1892 |
BloodPressure |
|
130 |
mm Hg |
Potain |
|
… |
|
|
|
|
|
|
|
123 |
June 1, 1897 |
BloodPressure |
|
107 |
mm Hg |
Riva-Rocci |
|
… |
|
|
|
|
|
|
|
123 |
June 1, 1902 |
BloodPressure |
|
120 |
mm Hg |
Cushing |
|
.. |
|
|
|
|
|
|
For brevity the device values above are listed as the individuals, instead of what they should be e.g., “Sphygmomanometer – Riva-Rocci Version”, or the like.
Discovery of Diastolic Pressure
A technique for measuring diastolic blood pressure, which is the pressure against the artery walls when the heart is relaxed between beats, wasn’t discovered until 1905 by Korotkoff. Diastolic blood pressure is “the bottom number” in common parlance, and it presents a new problem for our example patient because now there is another value to record.
Observation
|
Patient |
Date |
ObsType |
ValueStr |
ValueNum |
UOM |
Device |
|
123 |
June 1, 1882 |
BloodPressure |
|
135 |
mm Hg |
Von Basch |
|
123 |
July 1, 1882 |
BloodPressure |
|
105 |
mm Hg |
Von Basch |
|
123 |
Aug 1, 1882 |
BloodPressure |
|
120 |
mm Hg |
Von Basch |
|
… |
|
|
|
|
|
|
|
123 |
June 1, 1892 |
BloodPressure |
|
130 |
mm Hg |
Potain |
|
… |
|
|
|
|
|
|
|
123 |
June 1, 1897 |
BloodPressure |
|
107 |
mm Hg |
Riva-Rocci |
|
… |
|
|
|
|
|
|
|
123 |
June 1, 1902 |
BloodPressure |
|
120 |
mm Hg |
Cushing |
|
.. |
|
|
|
|
|
|
|
123 |
June 1, 1906 |
BP.systolic |
|
120 |
mm Hg |
Cushing |
|
123 |
June 1, 1906 |
BP.diastolic |
|
80 |
mm Hg |
Cushing |
|
.. |
|
|
|
|
|
|
To address this development new ObservationTypes are needed. The 1906 measurements in the example patient have new metadata – “BP.systolic” and “BP.diastolic” – to better represent the understanding that there are multiple blood pressure measurements. For comparison, LOINC, the standard for laboratory results and other observations, has the following component metadata for blood pressure:
76538-8 Blood pressure device Cuff pressure.systolic
76539-6 Blood pressure device Cuff pressure.diastolic
What about the older observation values that have been recorded? A couple decades of blood pressure values could exist with the prior ObservationType “BloodPressure”, and this raises a classic data upgrade scenario. There are risks in upgrading the data because ostensibly everybody already understands what the ObservationType “BloodPressure” means, but there are risks in not upgrading because there would be multiple blood pressure types in the chart. The typical response is to do nothing to the older values and let the analytics and reporting teams deal with it on the back end.
Note that the device-type for the 1906 values is still Cushing. The ability to measure diastolic blood pressure didn’t require a new Sphygmomanometer but rather a new technique and the ability to recognize something called the Koroktoff sounds. Arguably, a method attribute should be added to the Observation record for “Korotkoff”.
Change in Sphygmomanometer Model - Electronic
Electronic sphygmomanometers have been around since the 1980’s, but modern ones have done away with using Mercury because of its toxic properties.
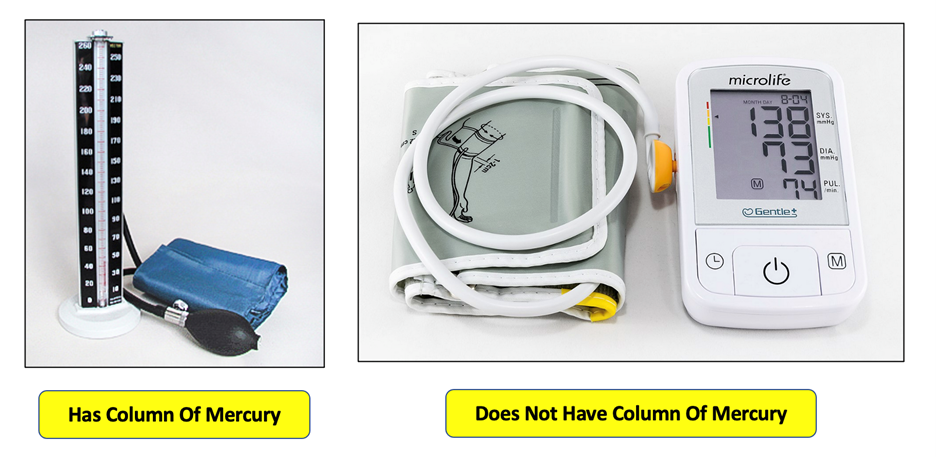
Images: from Wikipedia, comments from author
What is the unit of measure for blood pressure from an electronic Sphygmomanometer? There are several options in physics for measuring pressure, such as Pascals…
Observation
|
Patient |
Date |
ObsType |
ValueStr |
ValueNum |
UOM |
Device |
|
234 |
June 1, 1985 |
BP.systolic |
|
16000 |
Pascals |
Electronic |
|
234 |
June 1, 1985 |
BP.diastolic |
|
10666 |
Pascals |
Electronic |
|
… |
|
|
|
|
|
|
… or Atmospheres…
Observation
|
Patient |
Date |
ObsType |
ValueStr |
ValueNum |
UOM |
Device |
|
234 |
June 1, 1985 |
BP.systolic |
|
.157 |
Atm |
Electronic |
|
234 |
June 1, 1985 |
BP.diastolic |
|
.105 |
Atm |
Electronic |
|
… |
|
|
|
|
|
|
…and these values would be entire scientifically accurate. However, problems emerge immediately downstream when it comes time to interpret the results. Patient communication alone is reason enough to keep things the way they are with units of millimeters of Mercury. Somewhere in the physician’s office there is a chart from the American Heart Association that looks something like this:
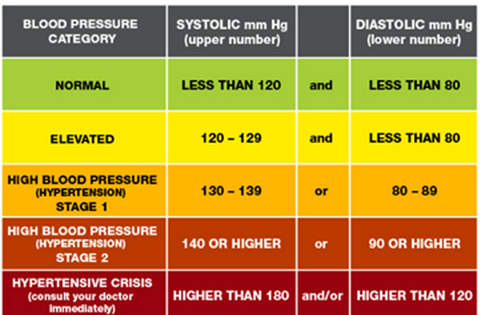
Image: Blood Pressure Guidance (Heart.org)
Teaching patients to understand charts like this, and stay compliant is hard enough the way it is now, much less trying to do it in Pascals, KiloPascals, Atmospheres, or other combinations of units. Thus, the electronic Sphygmomanometer is subject to a “backward compatibility” issue that so many other technologies have encountered. The electronic results are converted back into millimeters of Mercury because that’s what people currently expect of blood pressure measurement, but that is not how the device actually works.
Observation
|
Patient |
Date |
ObsType |
ValueStr |
ValueNum |
UOM |
Device |
|
234 |
June 1, 1985 |
BP.systolic |
|
120 |
mm Hg |
Electronic |
|
234 |
June 1, 1985 |
BP.diastolic |
|
80 |
mm Hg |
Electronic |
|
… |
|
|
|
|
|
|
Lastly, blood pressure readings, even those measured electronically, are typically manually recorded in electronic medical records, but that is a story for another day.
Special Thanks
Special thanks to former Explorys colleague Olivier Izad for sparking my interest in blood pressure measurement, and for the blood pressure conversion calculations.
Links
Sphygmograph
https://en.wikipedia.org/wiki/Sphygmograph
Sphygmograph – Nature (1873)
https://www.nature.com/articles/008330a0
Sphygmomanometer
https://en.wikipedia.org/wiki/Sphygmomanometer
Mercury (element)
https://en.wikipedia.org/wiki/Mercury_(element)
History of Blood Pressure
https://www.bloodpressurehistory.com/blood-pressure-history
American Heart Association
https://www.heart.org/en/health-topics/high-blood-pressure
LOINC
Dittrick Medical History Center (Case Western Reserve University) – which has a collection of medical equipment, books, and other artifacts.
https://artsci.case.edu/dittrick/
Korotkoff Sounds
https://en.wikipedia.org/wiki/Korotkoff_sounds
Related

Emerging Technologies
Articles

Emerging Technologies
Articles

