Quality Care
Davies Award of Excellence

Executive Summary
Children's Hospital of Orange County (CHOC) developed a pediatric readmission rate predictive model to assist clinicians in reducing unplanned readmissions and enhance the understanding of risk factors leading to such readmissions. The rate of pediatric seven-day and 30-day unplanned readmissions are closely tied to quality of care, with high rates indicative of needed improvements in the quality of care. In a systematic progression of iterations, the organization used machine learning on electronic health records to study predictors of both seven-day and 30-day readmissions in pediatrics. By using machine learning data to more accurately predict which patients were most likely to be readmitted, the organization gained an opportunity for providers to proactively take measures to reduce the likelihood of readmission. The clinical readmissions team adopted the predictive model, which is now integrated into the EHR, allowing caretakers and providers to see the readmission risk for hospitalized patients. Knowing which patients are at a higher risk to return and the risk factors contributing to this risk, helps providers decide whether clinical interventions are needed to improve quality of care and prevent readmission. In other words, the predictive model advanced the organization towards targeted interventions for readmission risks. The probability of readmission score is assessed daily during the morning huddle on 100% of patients and can be reassessed at any time, for example, prior to discharge to ensure any potential condition changes are acted upon to prevent a readmission. The readmission transition of care committee meets monthly to review the current state of readmissions and to monitor for areas of improvement.
After years of maintaining an average seven-day unplanned readmission rate around 4%, the organization was able to decrease the unplanned readmission rate to ~3% with the utilization of the near real-time readmission predictive score. More specifically, in 2013, the seven-day readmission was 3.8%, and the 30-day rate was 12.3%. In 2019, however, after implementation of the near real-time tool, the readmission rate was 3.3% and 11.0% for seven- and 30-day rates respectively.
The technologies include data within the EHR, dashboards, a population health database platform, and on-demand cloud computing platforms and application programming interfaces. The readmission prediction team includes bedside care providers, case management and social services, the quality team, the healthcare informatics team, the readmission transition of care committee, and the data scientist/analytics team. The process is driven by data and evidence-based clinical decision support at the point of care, equipping the care teams with the necessary knowledge to decrease the unplanned readmissions. The process is driven by a multidisciplinary team approach to address improvements in quality of care, social determinants of health, and increase access to follow-up care, including a telehealth approach. The main goals were to utilize machine learning to significantly improve the process for creating predictive algorithms and data management, push the more robust predictive score to the point of care, and to ultimately decrease unplanned readmissions.
Lessons learned include:
- Prior to creating a predictive model, do literature reviews on all available articles to become familiar with what is already known about the event of interest.
- Ensure that research is conducted and peer reviewed to validate methods and approach before implementation.
- Include the clinical team in discussions regarding the variables to be used in the model.
- Take your time and understand how each variable impacts the model—artificial intelligence, machine learning and cloud computing enhance this ability to test scenarios.
- Utilize a multidisciplinary team approach to address unplanned readmissions.
- Understand the potential points of failure the patient may need to overcome to prevent a possible readmission.
Defining the Clinical Problem and Pre-Implementation Performance
Despite efforts to reduce readmissions within seven days of patient discharge, CHOC's readmission rates were consistently in line with averages experienced by our peers. The Solutions for Patient Safety (SPS)—a consortium of children’s hospitals—is a national group that the organization belongs to. In the SPS graph below, the seven-day unplanned readmission rate for the organization in comparison to other members of the SPS network is shown. The organization had not seen a reduction in readmission rate although we were performing well relative to other members of the SPS network. CHOC had applied many interventions (shown on the right hand side of the graph, Figure 1), but had minimal success in reducing readmissions. The minimal improvement led the organization to engage the data scientist to assist with development of a predictive model aimed at helping clinicians better anticipate patients at risk for readmission.
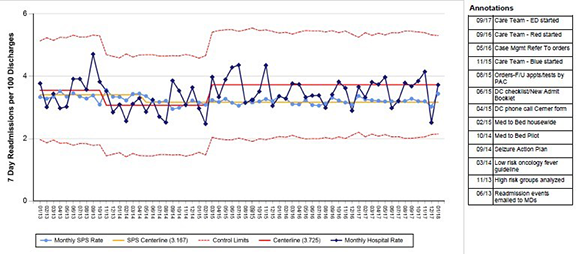
Figure 1: SPS-reported data on CHOC Children's seven-day unplanned readmissions | Source: Children’s Hospital of Orange County
By using machine learning data to more accurately predict which patients were more likely to be readmitted to the hospital, the organization gained an opportunity for providers to proactively take measures to reduce the likelihood of a readmission.
The initial model was created using a homegrown on premise model and data science which relied on statistics, data analysis and algorithms. The organization focused on the idea to reduce unplanned readmissions, with the first step being the identification of data elements needed for the study. Once the data elements were identified, the organization researched the sources of the data, extracted the data, loaded the data into a secondary database, and analyzed the data to assess the area under the receiver operator characteristic curve for accuracy. These steps were repeated until the model reached the required performance, and then the organization implemented the algorithm into spreadsheets. Eventually, the algorithm was integrated into the EHR. Typically, the process in the on premise system would take approximately six months or longer to complete, data access was limited, and data analysis tools were minimal.
To create the ideal data science environment for more robust analytics, CHOC entered into a development partnership with our EHR provider to achieve the following goals in leveraging a cloud-based platform:
- The organization would not be limited by access to data
- Data elements needed for analysis would be easy to identify
- The organization would not have to spend an extended time preprocessing this data
- The organization would not be limited by computing resources
- The organization would have access to all available big data analysis tools
The change from an on premise environment to the cloud-based data lab vastly improved the data process. Benefits include working in an elastic environment with healthcare data, complete datasets visible in the FHIR data model standards, a scalable environment; integration of toolkits, and closed-loop intelligence. This allowed the inclusion of additional risk factors in the model; vastly improving the turnaround time for analysis and improved the area under the curve (AUC) from 0.79 to 0.82. In the modeling studies, the numerator was the number of patients returning within seven or 30 days of a previous discharge, and the denominator was the total number of patients admitted for children aged > 28 days but < 18 years and excluded chemotherapy and neonatal patients. Targeted goals to decease the unplanned readmissions was to improve the AUC for the predictive model, integrate the near real-time readmission predictive score into the EHR, and to improve the connectivity of the patient back to the primary care provider (PCP) for follow up.
Designing and Implementing Model Practices and Governance
CHOC's chief health information officer (CHIO) and data scientist were key stakeholders in bringing the development partnership opportunity to our leadership. They understood the benefits of a more efficient data environment to provide the key benefits of data in improving outcomes. Data preparation accounts for about 80% of the data scientist's time, leaving less time to analyze data to deliver new insights. The solution was to create a better data environment to eliminate the barriers and obstacles, and to enhance the tools required to achieve peak performance. By pulling the data and the tools into a single environment, they were better equipped to manage the data needs of the clinical community (Figure 2).
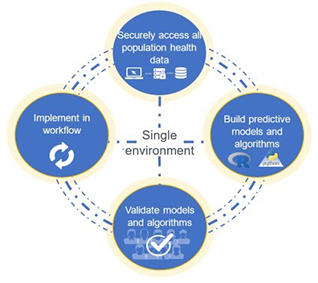
Figure 2 | Source: Children’s Hospital of Orange County
Benefits of the single environment include closing the loop with solution integration capabilities to push insights back into an enterprise data warehouse (EDW) for visualization or deploy predictive models into workflows (Figure 3). The utilization of near real-time predictive scoring allows the clinical team to engage in operationalizing the information.
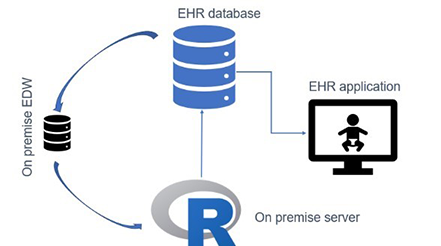
Figure 3 | Source: Children’s Hospital of Orange County
The clinical team is comprised of case management, social services, nursing, interdisciplinary care team members, PCPs and office staff. Engaging the clinical team in the development brought additional value to the analytics team as they guided the development of the inclusion metrics. Clinical variables for the algorithm included the Pediatric Rothman Index®, demographics and socioeconomic data, resource utilization, disease severity, medications and diagnosis. Additional elements that proved to be important included prior readmission status and nutritional stability.
Training encompassed education for the clinical team with a focus on utilizing the probability for readmission tool as an adjunct to their clinical decision-making, the addition of assessment tools for case management (readmit interview), social services (social determinants of health), and the mPage™ for visualization of the risk for readmission. The probability for readmission score can be viewed from the clinical dashboard and from accessing the mPage as part of the electronic health record. Education for the readmission tool itself was delivered during the morning huddle with discussion points on its intended use. Together, the CHIO, data scientist, health information team, and the clinical team refined the prevention of readmission process by relying on predictive analytics pushed directly to the care team.
Enabling Clinical Transformation Through Information and Technology
CHOC's initial goal was to build the most predictive model for 30-day readmissions under the most stringent set of inclusion/exclusion criteria (Figure 4). We utilized the 30-day model because it is a generally accepted metric for readmission. We also found that a 30-day model was a better predictor of seven-day readmissions than the seven-day specific model. The model started with about 47K patients, but with exclusions, ended up with ~38K in the initial study.

Figure 4: Study design of original model | Source: Children’s Hospital of Orange County
Following an extensive review of readmission literature, additional data elements were identified to add to the model including the Rothman Index® for a severity of illness score, medication classes, prior readmissions and if the current admission was in fact a readmission. The initial readmission predictive model yielded a model that was the most reliable for pediatric readmission models (encounters for chemotherapy excluded) with an AUC of 0.79. The organization chose the following thresholds on analyzing the performance of the model and predicted probabilities:
- High risk: Predicted probability greater than or equal to 0.22
- Medium risk: Predicted probability between 0.11 and 0.22
- Low risk: Predicted probability less than 0.11
Essentially, among high risk patients predicted, three will be flagged daily, of which, one is guaranteed to be readmitted in the absence of an intervention.
In the initial clinical application of the readmission model, the organization initiated the use of the published model via spreadsheets utilized by the inpatient case management staff. Those with high risk were assessed daily from admission to discharge to observe for and target any needed interventions as well as plan for follow up post-discharge. The readmission risk score was then subsequently integrated into the EHR (Figure 5).
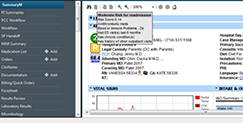
Figure 5: Implementation and display of readmission risk in the EMR—mPage | Source: Children’s Hospital of Orange County
On the mPage summary sheet, for example there is a readmission icon that, once hovered over, will present the score and driving factors influencing that risk of readmission. The initial work was well received; however, the data process was extremely cumbersome and time consuming (Figure 6). With the move to the data lab and cloud-based computing, CHOC was able to improve the subsequent iterations of the predictive model for readmission prediction. In the current data environment, the organization is not limited to data access, can quickly identify data elements needed to grow the model, and does not have to spend extended time preprocessing data (Figure 7). Mapping data elements via the FHIR data standards into the cloud platform was accomplished, and access to available big data analysis tools is now possible. The big data will include information such as images and natural language processing for texts when that becomes available. The workflow of the data and the way the organization creates the predictive models for readmission evolved overtime. This also allowed for access to de-identified data from other facilities, which provided extraordinary power to the data scientist and team for model advancement into many areas of patient care.
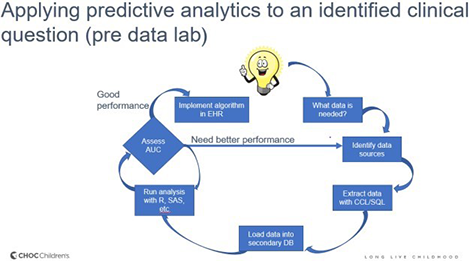
Figure 6 | Source: Children’s Hospital of Orange County

Figure 7 | Source: Children’s Hospital of Orange County
The workflow of the data team is only part of the equation. The outcomes and reduction in readmissions are driven by the care team's ability to operationalize the data and translate the work into meaningful information (Figure 8).
Once the readmission prediction score is accessed in the EHR or on the clinical dashboard, the care team utilizes the score to assess the potential for readmission. The score is utilized by clinical teams such as case management and social services who complete additional readmission prevention assessments. Their goal is to evaluate the factors generating the score and lead the clinical huddle discussion to plan for the patient's discharge. Key factors include issues that led to recurrent readmissions, nutritional assessments, current medications, social determinants of health, overall health literacy, and any barriers to follow-up appointments post-discharge. This work also led to the development of a nursing readmission tool to improve the discussion points between the nurse and the patient's family. CHOC revised the social worker’s assessment form to better address patient needs and recently implemented the PRAPARE assessment. This assessment, still in a pilot phase, will assist social workers in addressing issues impacted by SDOH. One of the key factors identified was the need for telehealth as an adjunct to improve care upon discharge and to help connect patients back to their primary care provider.
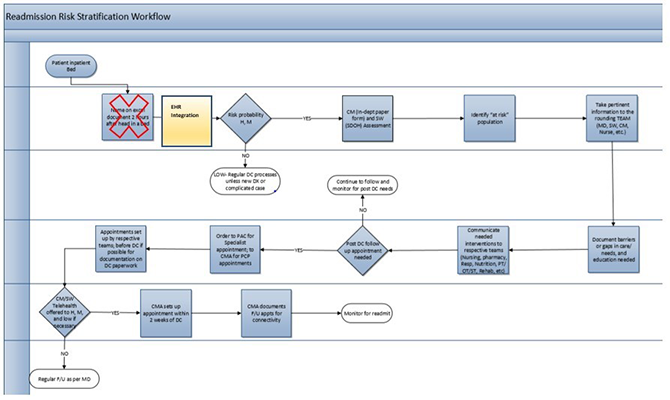
Figure 8 | Source: Children’s Hospital of Orange County
The workflow focuses on the patient from admission to discharge and through follow-up planning. To increase and sustain the PCP post-DC touchpoint above 85%, the teams utilize phone calls, telehealth, and measured the PCP appointment status on a dashboard view (Figure 9).
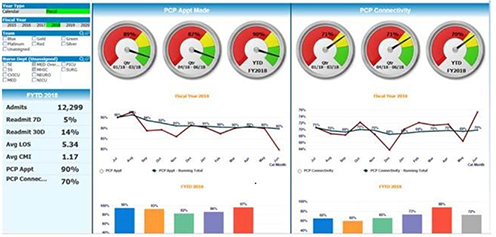
Figure 9 | Source: Children’s Hospital of Orange County
The clinical team is alerted—from admission through the patient's entire stay—to the probability of readmission. The clinical team is empowered to address in-house interventions like education, DC referrals, and community-based resources to address SDOH such as nutritional challenges, transportation, and DC follow-up planning with the PCP.
Improving Adherence to the Standard of Care
CHOC's CHIO and data scientist saw an opportunity to improve a key element of the readmission prevention recommendations by not only identifying high-risk populations, but by attacking readmissions with a concentrated effort. In 2018, the organization published its first study describing the initial work to create the readmission predictive algorithm. This opened the door to push the near real-time predictive tool to the point-of-care. In 2020 the organization published the current iteration of the tool, which proved to be a stronger predictive model and is based on a cloud computing platform offering more robust data access and utilization. In the modeling studies, the numerator was the number of patients returning within seven or 30 days of a previous discharge, and the denominator was the total number of patients admitted for children aged > 28 days but < 18 years and excluded chemotherapy and neonatal patients. The numerator in the average readmit rate in the outcomes data is the number of patients returning within seven or 30 days of a previous discharge, and the denominator is the total number of patients admitted. Using HealtheDataLab™ the organization improved its AUC for 30-day hospital readmissions from 0.79 to 0.822. AUC measures predictive model performance, with an AUC closer to one being better. Improving a model by even 0.01 can be challenging. The model is one of the most accurate in the children’s population health literature and uses data from 48 hospitals and 1.4 million encounters. In the operational use of the tool, the clinical team has access to the score on 100% of the patients. Case management and social services follow medium and high-risk patients to minimize the probability of readmission and follow readmission prevention plans within the EHR.
Follow up activities include, but are not limited to:
- Scheduling PCP appointments (Figure 11 represents adhering to the process to increase scheduling the PCP follow-up appointments)
- Follow-up phone calls
- Telehealth
- Targeting SDOH such as food insecurities and transportation needs
- Barriers to access medications
- Education
Follow up appointments are tracked via analytics such as reports and dashboards, and readmission rates and events are discussed at monthly meetings. Compliance to the readmission prevention indicators are discussed on a case by case event. The readmission prediction score is a by-product of data within the EHR, the care team readmission follow up assessments are captured within the EHR, and the readmission score on all patients is populated on clinical dashboards and the mPage within the EHR.
While benchmarking with SPS, the organization realized efforts to reduce readmissions within seven days of patient discharge remained consistently in line with averages experienced by our peers. The CHOC team routinely followed the recommended practice to reduce readmissions which included:
- SPS Standard Elements—also see Annotations (Figure 10)
- Schedule follow-up medical and post discharge tests/labs appointments prior to discharge
- Identify high-risk populations of patients and develop specialized care coordination plans (e.g., sickle cell, asthma, seizures, etc.)
- Post-discharge follow-up call to reinforce discharge instructions with a standardize script
- Discharge instructions contain a plan on potential problems and what to do if they arise (as in who to call)
- Provide feedback to clinicians on any readmission
Figure 10: SPS standard elements | Source: Children’s Hospital of Orange County
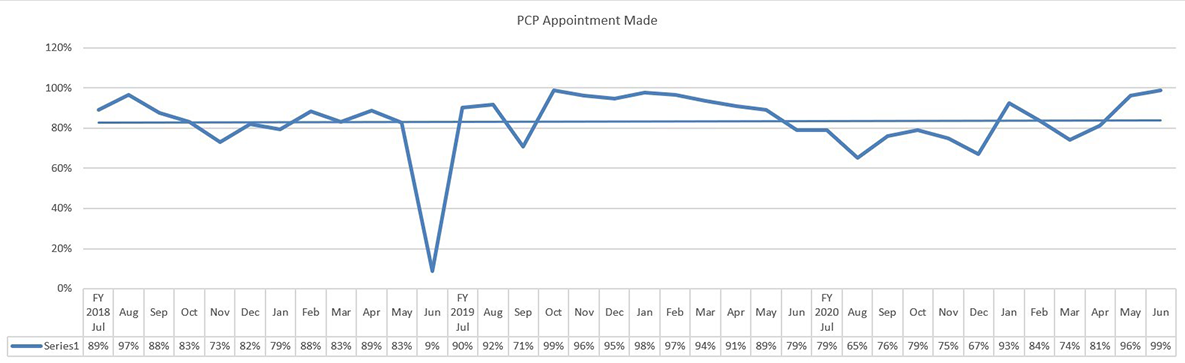
Figure 11: Increased PCP appointments | Source: Children’s Hospital of Orange County
Improving Patient Outcomes
CHOC has seen significant decrease in the readmission rates for both the seven-day and 30-day metrics. This can be seen in the control charts in Figures 12 and 13, with both metrics meeting the Western Electric rules for non-random change/improvement.
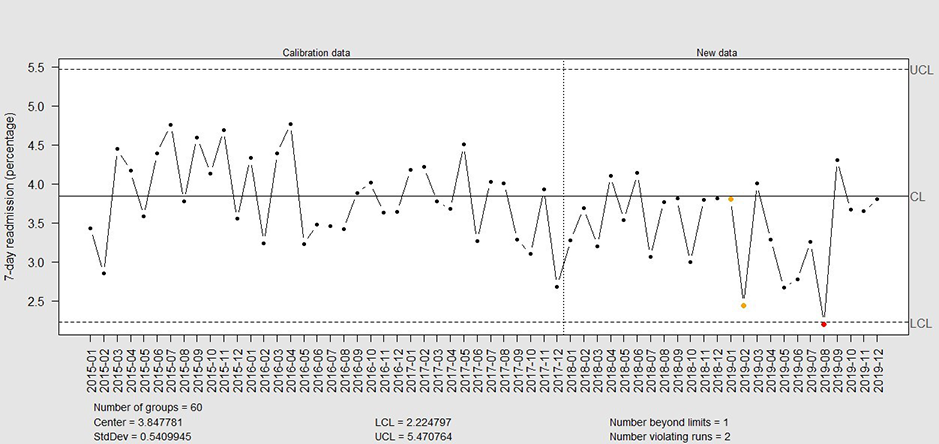
Figure 12: Control chart for drop in seven-day readmission rates | Source: Children’s Hospital of Orange County
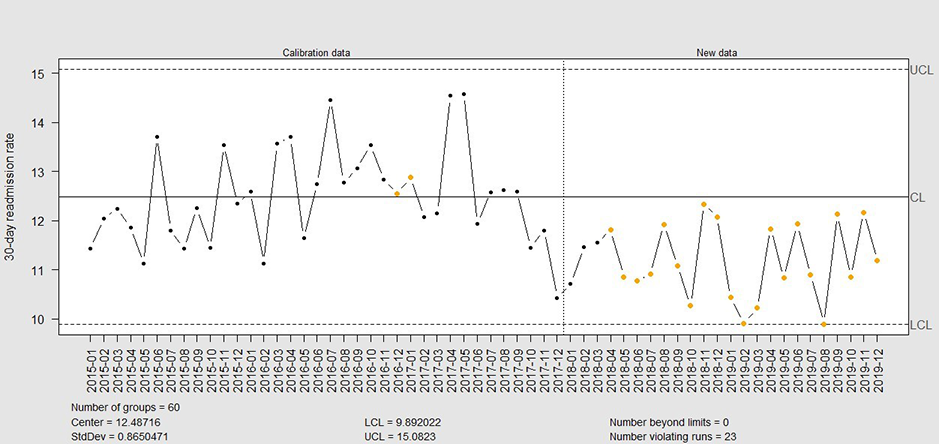
Figure 13: Control chart for drop in 30-day readmission rates | Source: Children’s Hospital of Orange County
The drop in readmission rate is better seen in a rolling 6-month window of the readmission rates as shown in Figures 14 and 15.
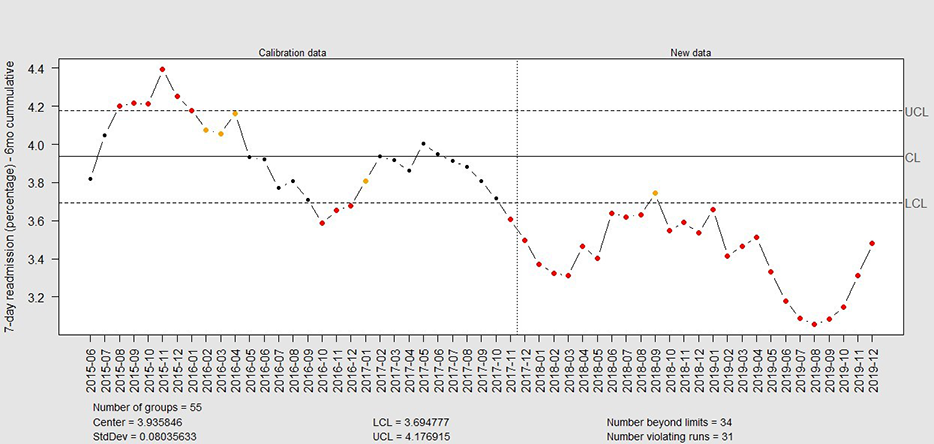
Figure 14: Control chart for six-month rolling window seven-day readmission rate | Source: Children’s Hospital of Orange County
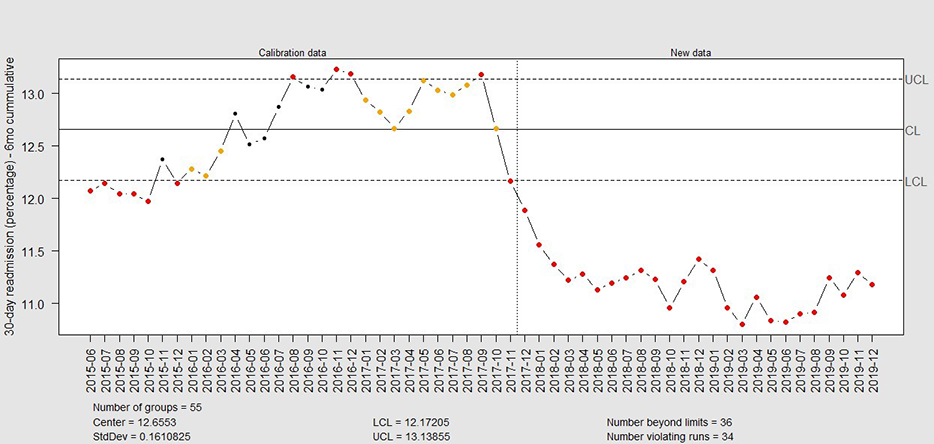
Figure 15: Control chart for six-month rolling window 30-day readmission rates | Source: Children’s Hospital of Orange County
Accountability and Driving Resilient Care Redesign
The information within the HealtheDataLab™ encompasses identified and de-identified data that is encrypted for confidentiality and is HIPAA compliant. Key benefits include:
- Elastic environment with query-able healthcare data
- Complete datasets visible in the FHIR data model standards
- Scalable environment
- Integration of toolkits
- Closed-loop intelligence
This is how CHOC manages data today (Figure 16):
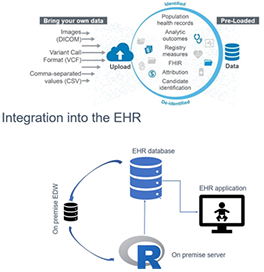
Figure 16 | Source: Children’s Hospital of Orange County
The data elements required to generate the prediction for readmission are routine data points captured via normal documentation along with lab results and assessment data. The integration of the data through the EHR and the capture of data into the cloud computing platform allow for the seamless availability of the score at the point of care. The score itself is available on clinical dashboards and the EHR mPage (Figure 17). The case management and social worker assessments are also available within the EHR.

Figure 17 | Source: Children’s Hospital of Orange County
Once the data is pushed to the point of care, the care team discusses the probability of readmission during the morning huddle and before discharge. The case managers and the social work teams are strategically aligned with the bedside staff to identify potential points of failure in planning for a successful discharge, which includes close follow-up such as telehealth engagement to re-establish the interactions with the primary care provider after discharge. The readmission transition of care team meets monthly to review the overall readmission rates and evaluates current policies and processes. The PCP follow up visits are closely monitored, and reporting and dashboard views are available to support discussions as needed when readmission events occur. (Figure 18).

Figure 18 | Source: Children’s Hospital of Orange County
CHOC moved the mark on readmissions by pushing the boundaries of data access. After years of being "as average as our peers," the readmission rates improved due to the utilization of a strong predictive model and a clinical team who operationalized the near real-time score. The readmission predictive tool is just one of many utilized by the care team, however it is the first line of data defense in identifying the patient who needs that extra attention while being an inpatient and careful monitoring upon discharge and follow up.
The views and opinions expressed in this content or by commenters are those of the author and do not necessarily reflect the official policy or position of HIMSS or its affiliates.
HIMSS Davies Awards
The HIMSS Davies Award showcases the thoughtful application of health information and technology to substantially improve clinical care delivery, patient outcomes and population health.
Related

Quality Care
Articles


Quality Care
On-Demand Webinars